MIRROR – QUICK START
How to order a skin photoanalysis report – Quick Start Video
Accepted photo file types are JPG, PNG, TIFF and GeoTIFF. Maximum files size is 6Mb. For faster results, use smaller file sizes. For example, a 300Kb file may provide the results you need. To ensure your privacy, your uploaded photo is deleted from our servers when you log out. We do not keep any uploaded photos on our servers after you have logged out.
For best results:
- take photos that show the skin only or at least 80% of the photo should be of the skin
- ensure the photo is not blurry
- avoid shadows and very bright light and very low light levels
- remove makeup and sunblock – unless you are checking even application of either one
- use lower image resolution camera setting to get Mirror results faster (even 2 mega pixels quality works fine!)
How to use Mirror Platform for direct skin photoanalysis (for skin health care professionals only)
Direct access to MIrror is useful especially if you have a client with you and you want to analyse and discuss their skin care options right there and then. First log in to your Mirror account here. Then follow the guide below:
METHOD
Select a METHOD to see how light is affecting different areas of your skin. Which light is your skin absorbing or reflecting/blocking and to what extent? How is this affecting your condition and health? The following four Methods are the most commonly used:
- Vision by Reflection Level 1 – to view skin patches, level of redness (red blood cells concentration) and shininess
- Vision by Reflection Level 2 – to view blemishes like spots, pores, wrinkle formation, acne etc. (brown, red and dark spots)
- Vision by Absorption Level 1 – to view concentration of melanin (blue/dark) and of microorganism – also known as skin biome – like bacteria, fungus, archae etc. (greenish/yellowish)
- Trace Vision Level 1 – to view skin type zones (T-zones etc.)
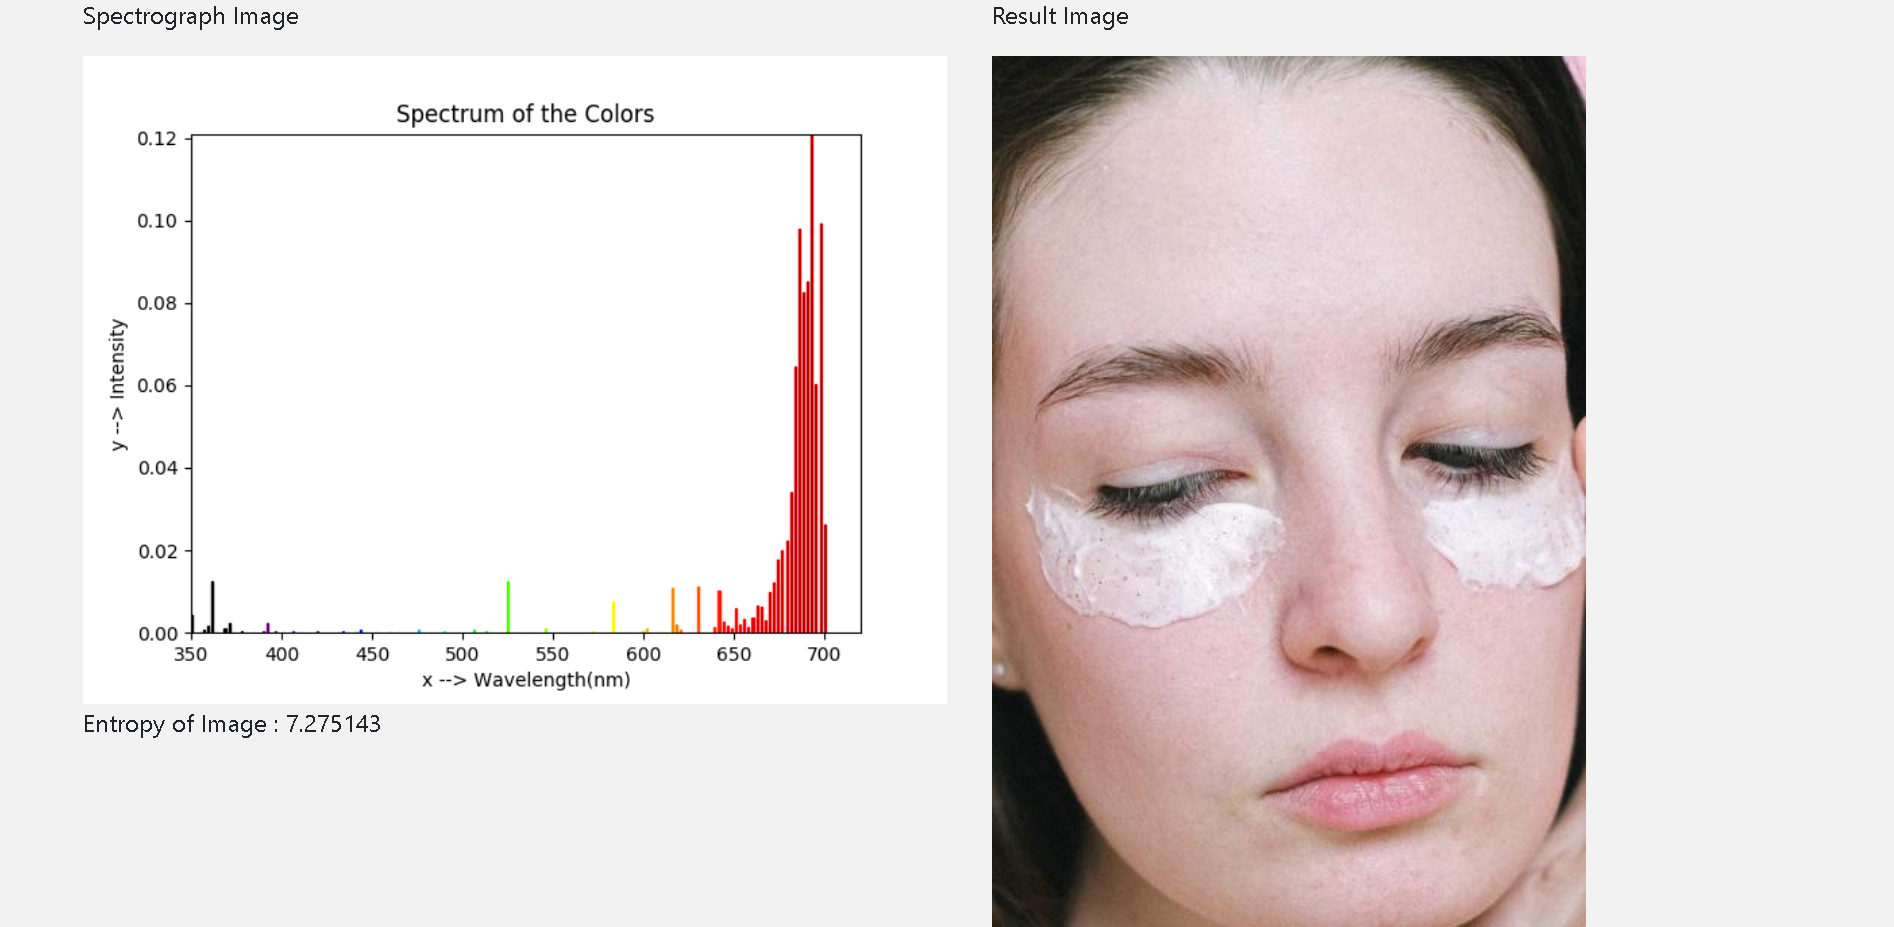
You can then save the result image. To get values for skin smoothness/roughness and tone eveness, select Spectrograph then view the Entropy value. The lower the value, the smoother, more even toned is the skin area. The spectrograph shows how much the skin is either reflecting or absorbing different light.
Ultra-Violet (UVA) radiation protection by melanin measurement
For example, checking the melanin concentration (Method 3. above) with the spectrograph shows how much the melanin in the skin is absorbing UVA (blue lines. the higher and the more blue lines, the more UVA light is being absorbed by the melanin). That means, the more the melanin is actively protecting the skin from UVA radiation.
How red and red by how much and how uneven is my skin tone? 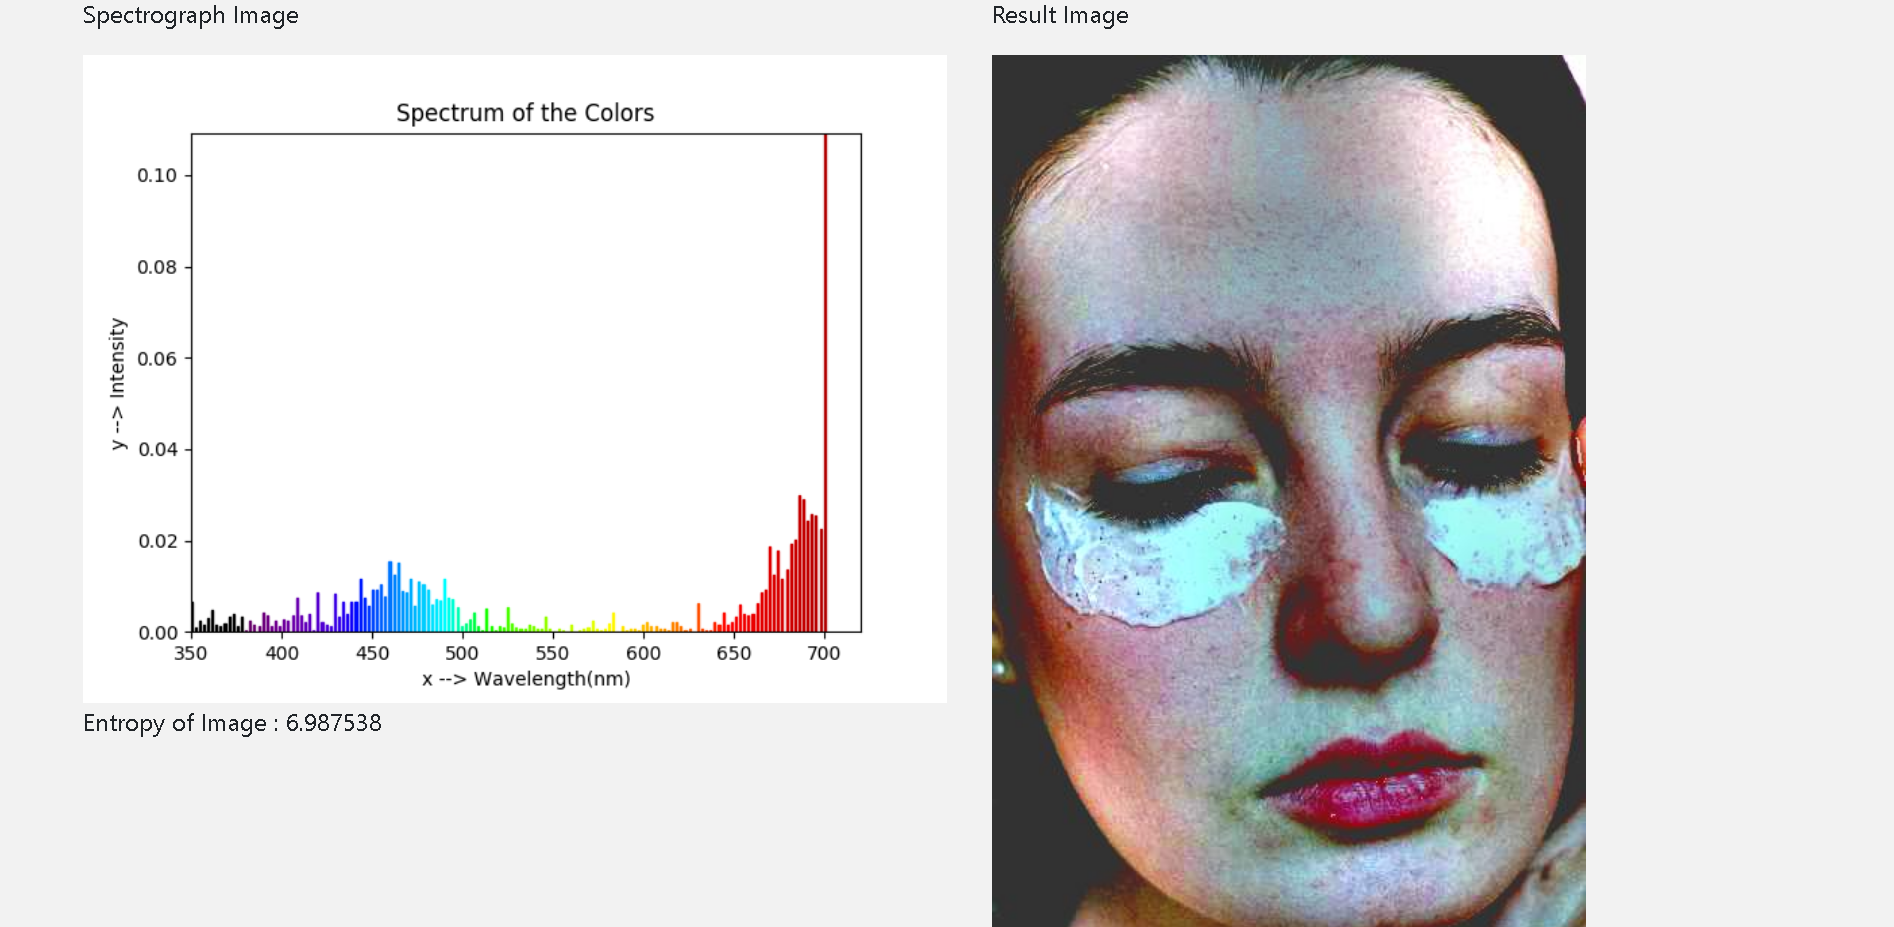
How shiny is my skin? Where are my underlying skin patches? Do I have underlying Vitiligo? 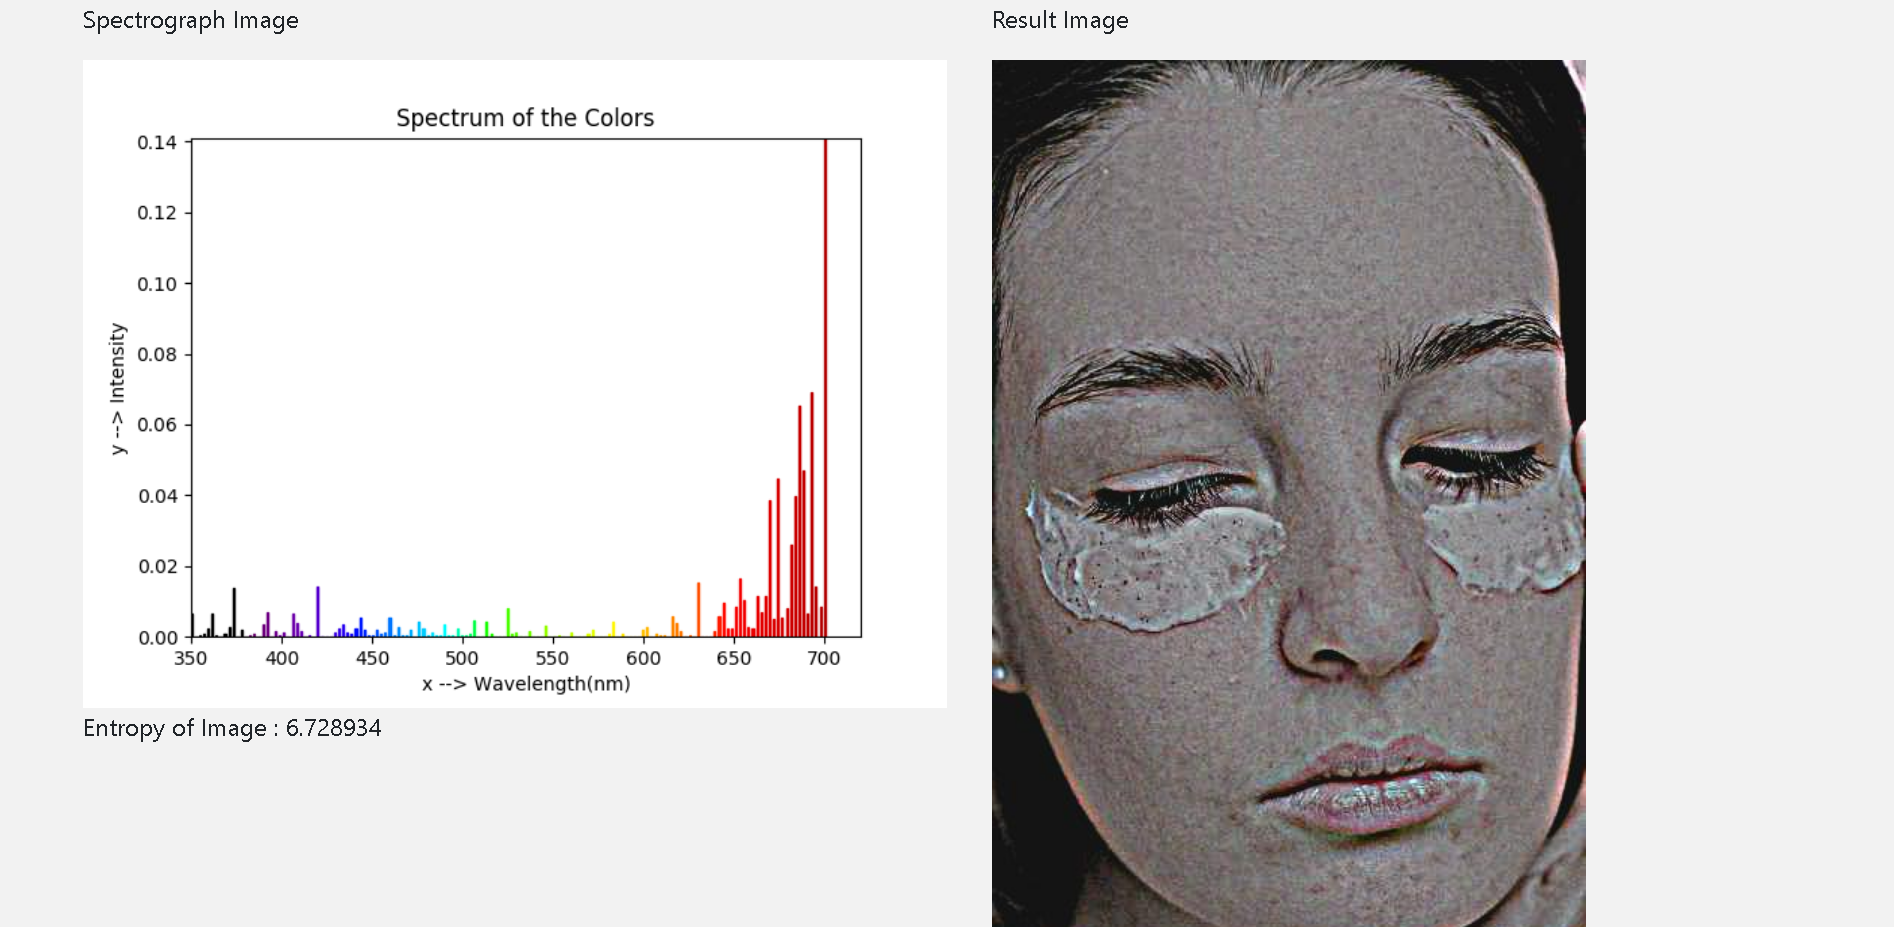
How deep are pimples, wrinkles, acne and spots? 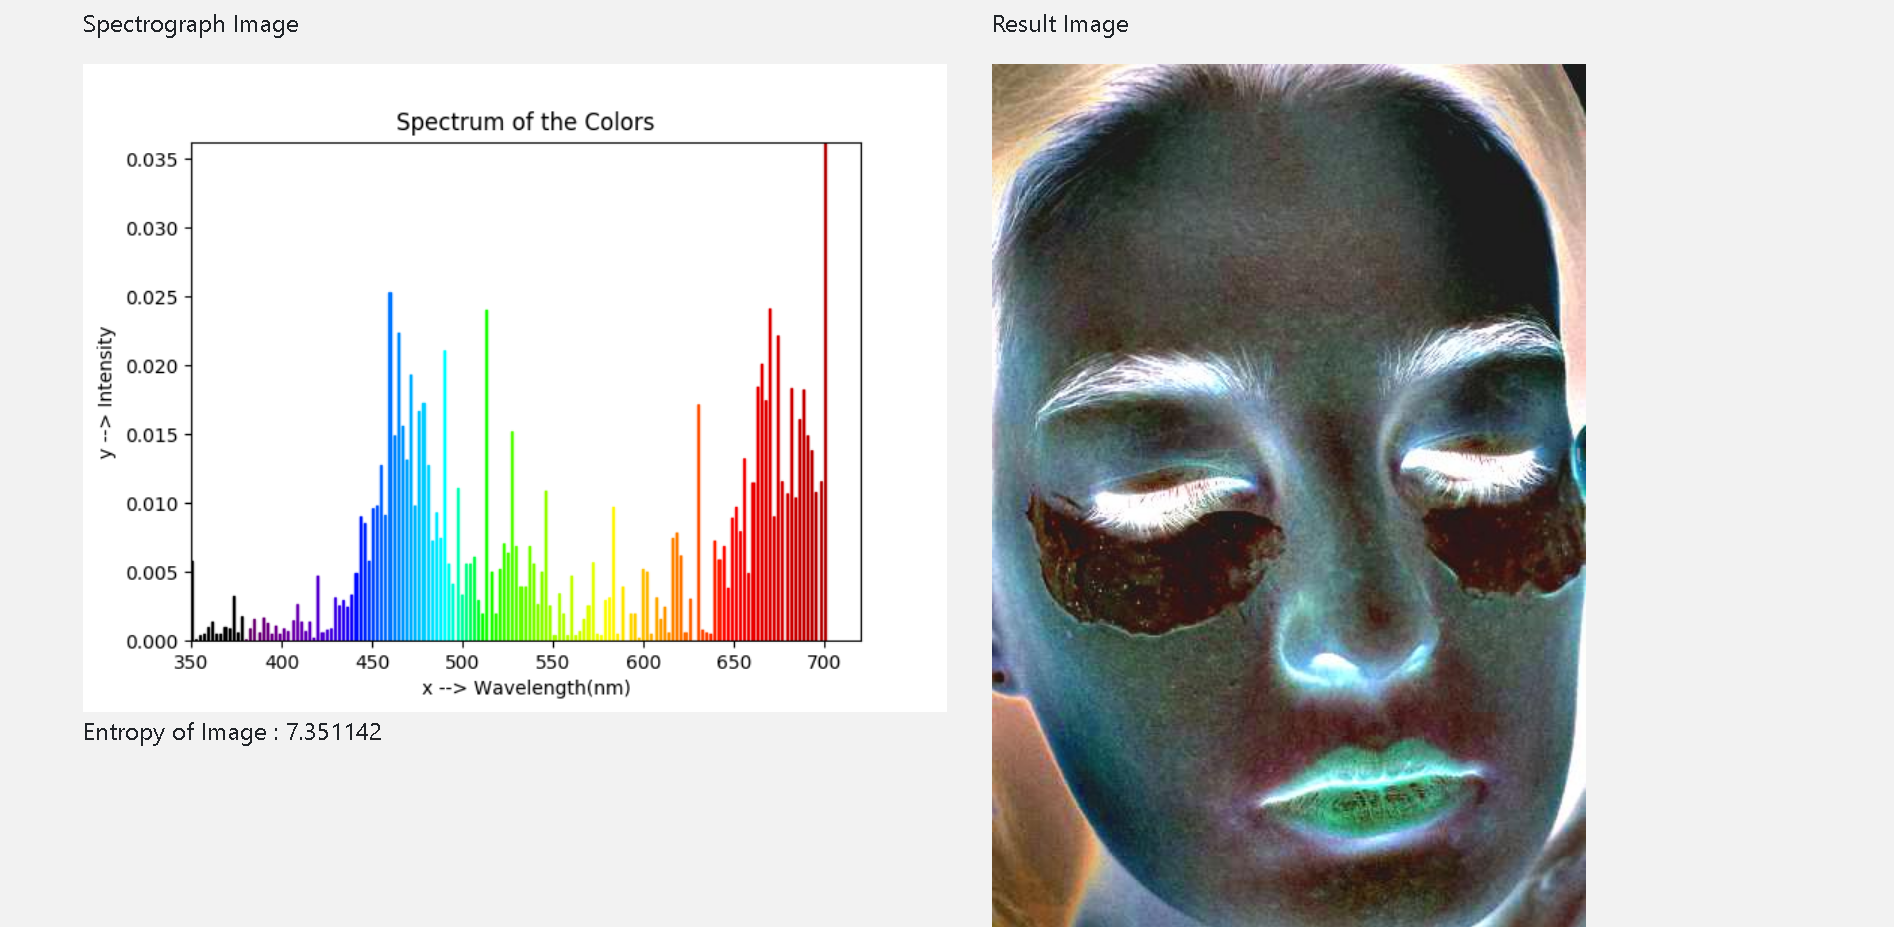
How effective is my melanin and sunscreen, where are abnormal bacteria activities on my skin? 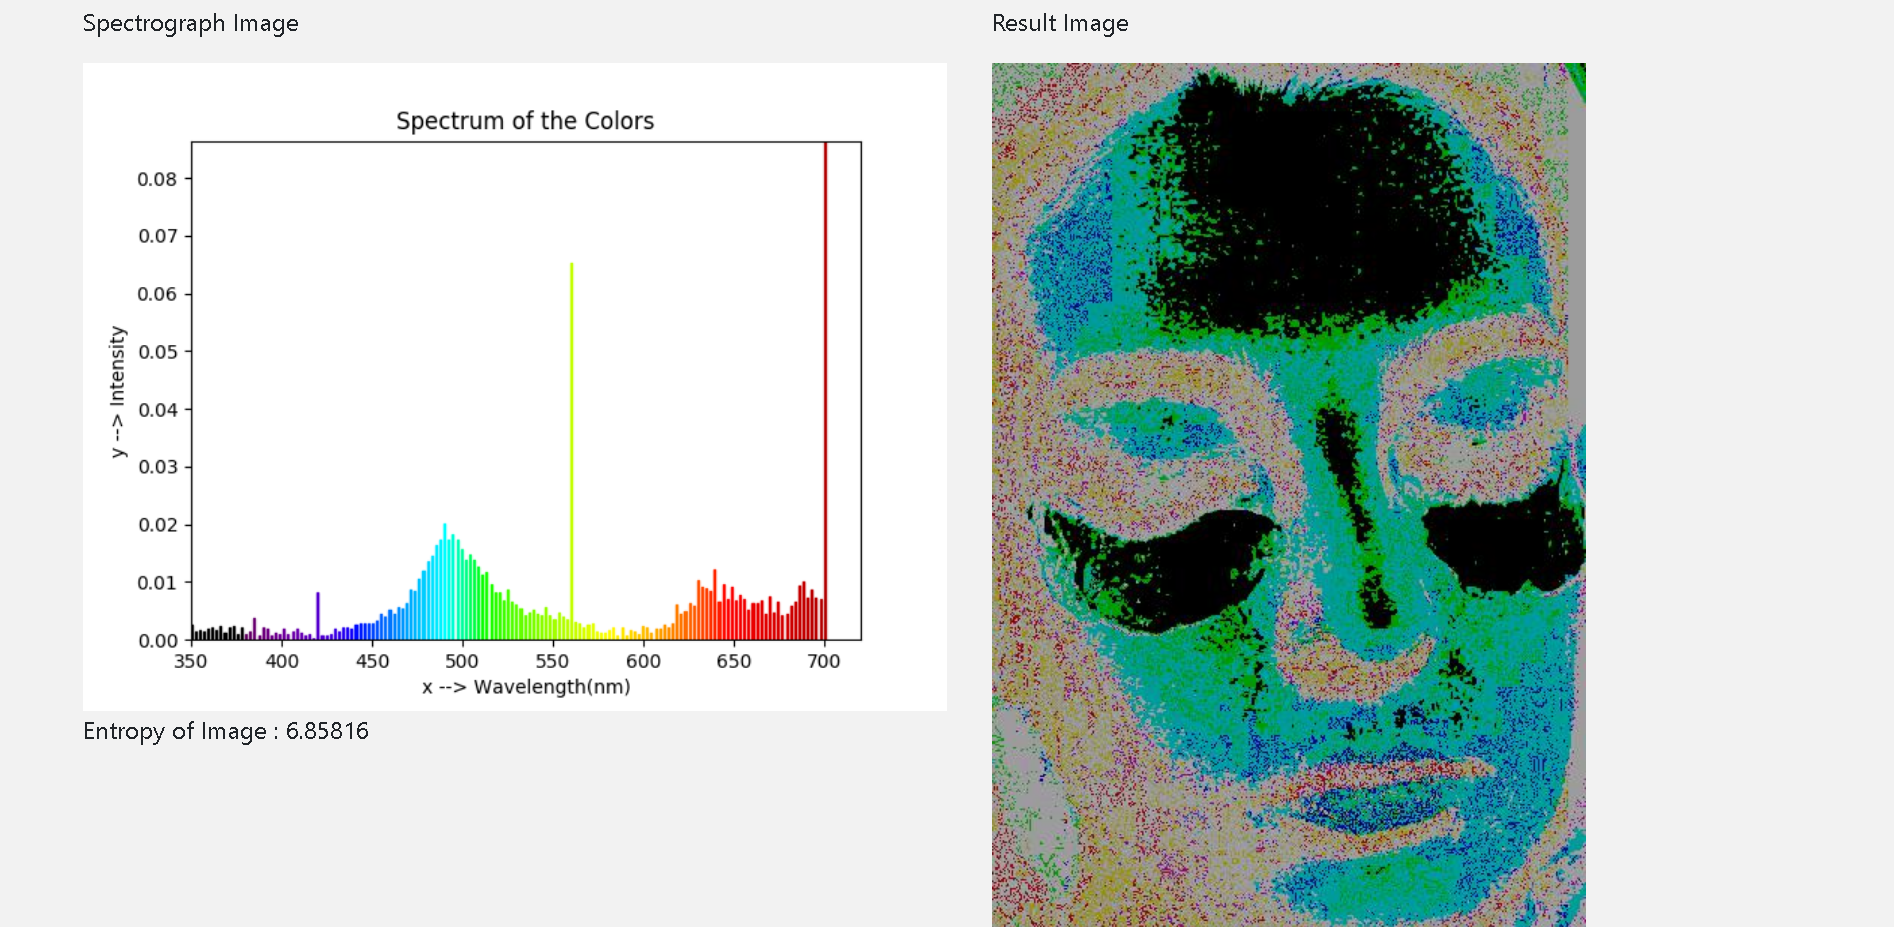
Where are my skin type zones?
Redness (red blood cells and damaged pores bleeding) measurement
Check the spectrograph after selecting Method 1. above. The more red lines and the higher they are, the more red blood cells can be seen. This could be because of very light tone skin or damaged pores or both.
Bacteria and or microorganism measurement
Check the spectrograph after selecting Method 3. above. The more green/yellow lines and the higher they are, the more bacteria and other microorganisms are present on the skin area. A balance of the right microorganisms or skin biome is important for maintaining a healthy skin. The reverse is also true.
SPECTROGRAPH
Select SPECTROGRAPH to see the colours of the visible light energy (wavelength and intensity) used (absorbed) or blocked (reflected) by your skin. For example: is it absorbing or blocking more UV light or Infrared light? UV activity is shown in shades of violet/purple colours at at the other end, Infrared activity is shown in shades of red. Melanin helps protect your skin and in combination with heamoglobin also determines your skin tone.
ENTROPY
The entropy value for your skin is an indication of the tone variability and texture of your skin. The lower the value, the more even is your skin tone and the smoother is the texture of your skin.
Is Mirror’s skin analysis system accurate?
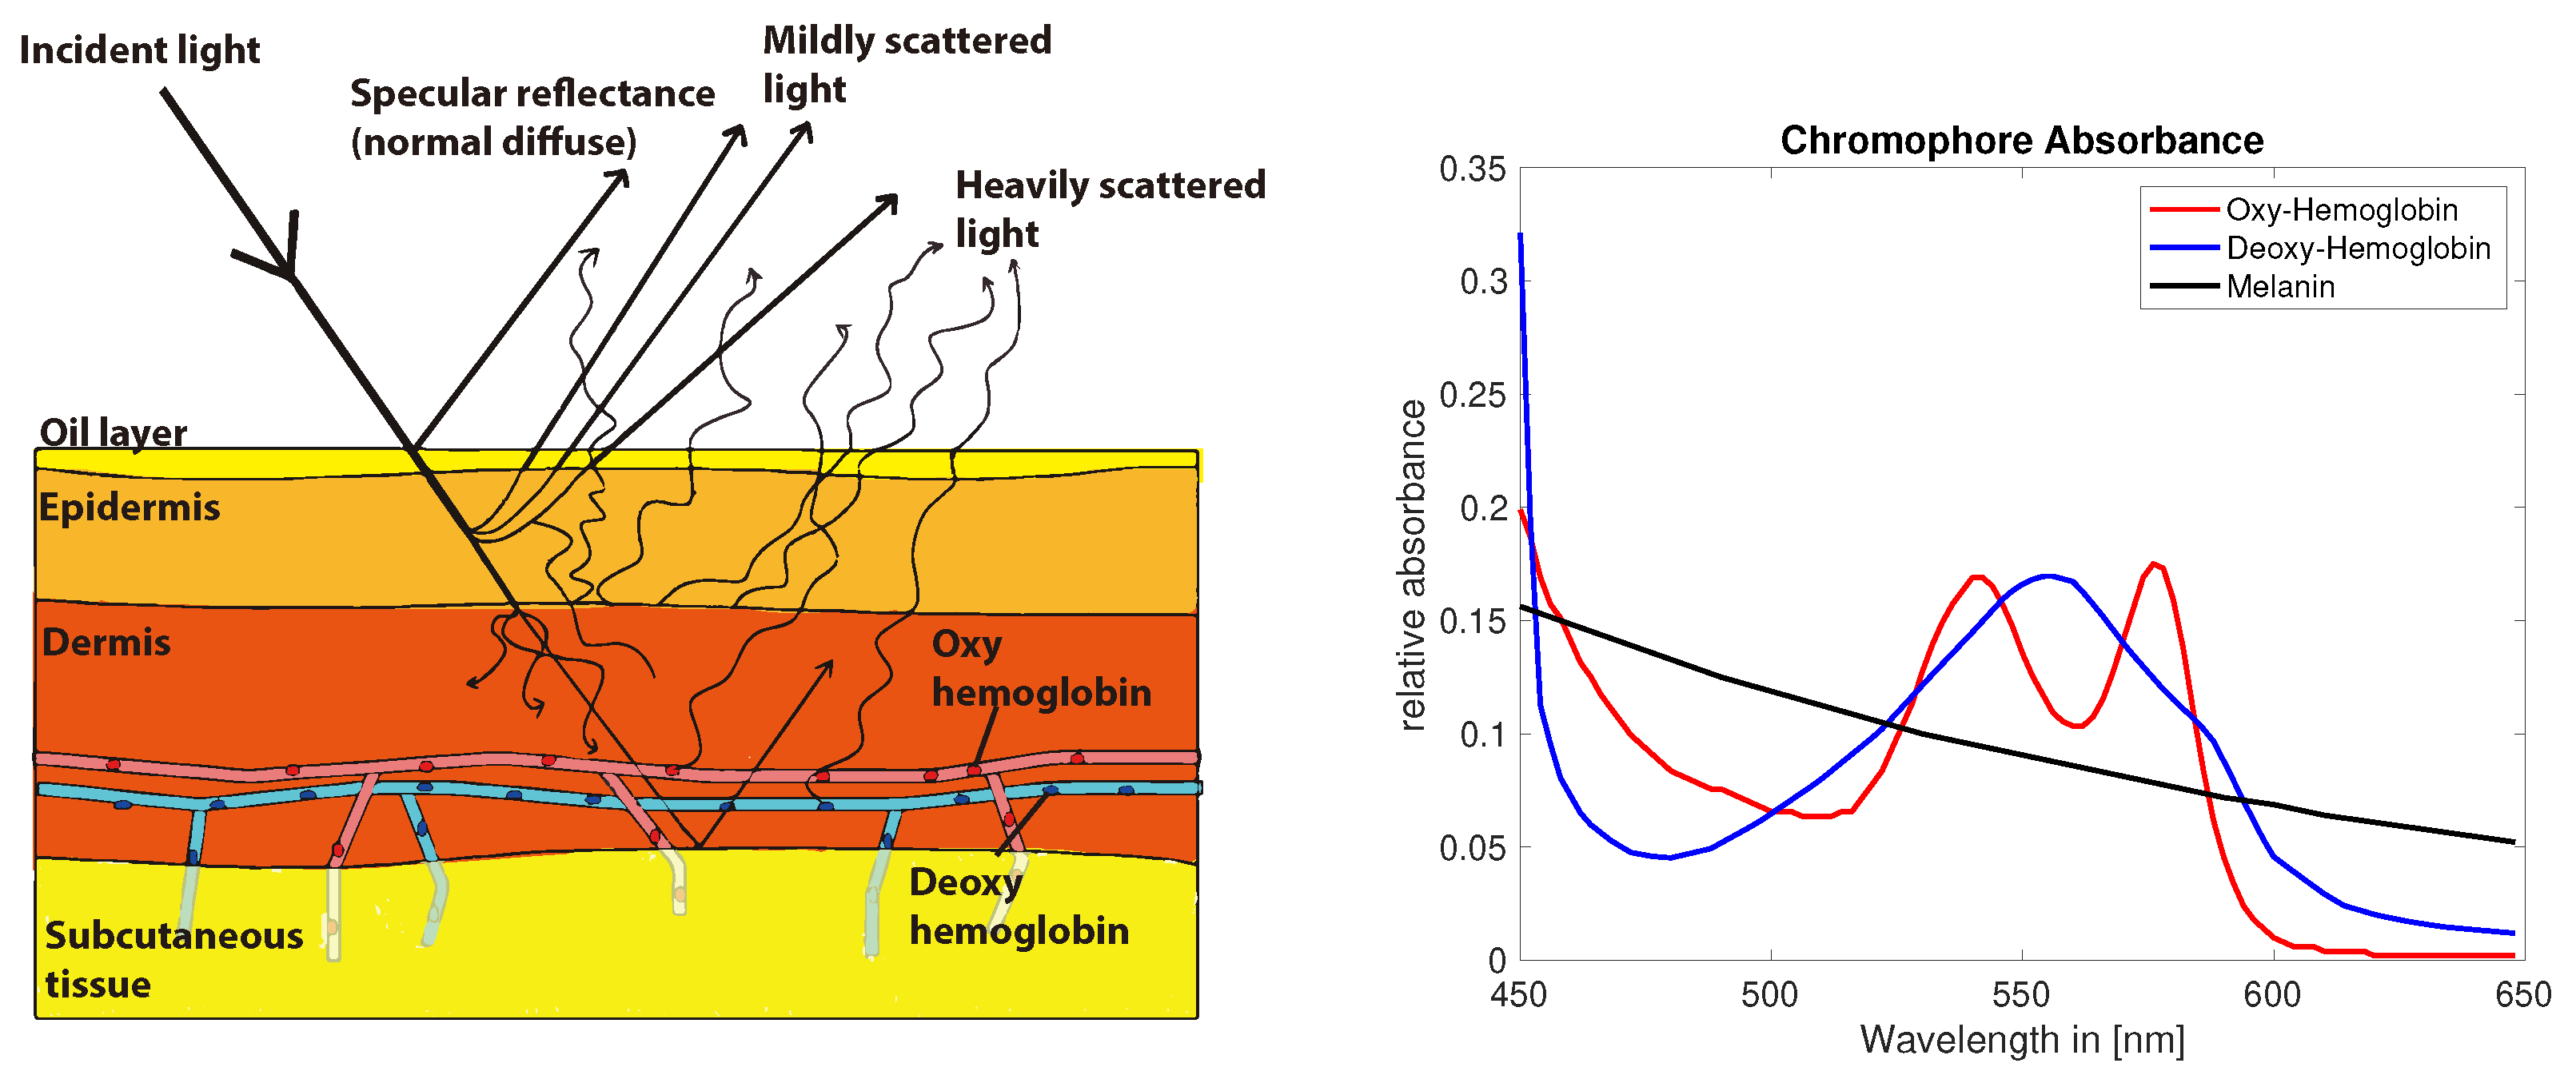
Take a quick look below. You’ll see a sketch of your skin layers next to a graph of how your skin’s melanin (black) and blood vessels (blue and red) react with light around you. These two determine to a very large extent, your skin tone at any one time. We also learn a lot about the state of your skin’s health by observing their behavior with different types of light we can see from UV/blue light (400nm) to infrared (700nm) or so as per the graph below.
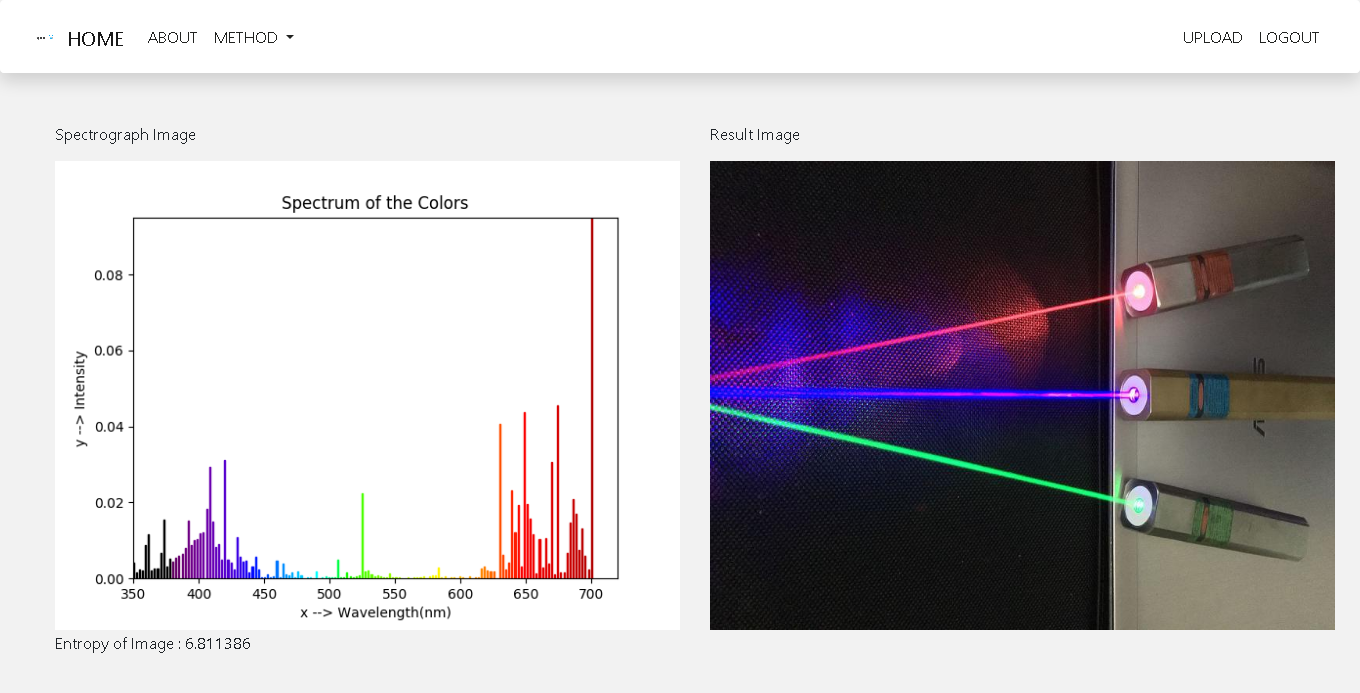
We’ve used highly accurate laser beams to test and prove the accuracy of the Mirror analysis system, as you can see from the next image with laser beams.
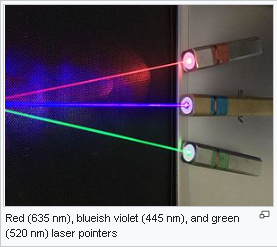
Red (635 nm), blueish violet (445 nm), and green (520 nm) laser pointers – Source: Wikipedia